Arts and Culture
Fundraising
BI and Analytics
Article
Insights & Innovation
20f1917d-fe92-471c-bbf0-7a26be1a03a2
5 min
https://edge.sitecorecloud.io/tessituraneab9a-tessiturane5642-staging-5396/media/Images/Discover-Images/Thought-Leadership/Data-overdrive-768x465.png?h=465&iar=0&w=768
Tessitura’s analytics tools allow you to answer critical end-of-year campaign questions.
Data overdrive: How to become a reporting rockstar during the year-end fundraising push

Solutions Manager, Tessitura Network
Data overdrive: How to become a reporting rockstar during the year-end fundraising push
10/11/2022
5 min
For fundraisers, the fourth quarter of the year is fraught with excitement and anxiety.
The fundraising strategies you put in place at the beginning of the year are paying off…hopefully. As you measure your progress against end-of-year goals, you’re constantly being asked questions.
“What gifts came in today?”
“How is the appeal performing?”
“Did that pledge payment come in yet?”
Tessitura’s analytics tools allow you to answer these critical questions and more. Your donor data can help you make informed decisions efficiently — even automatically.
With all interactions now available in Analytics, you can track a donor’s behavior before and after a donation is made. Alongside transactional data, you can analyze all other interactions and engagement points. Those include promotions, customer service issues, special activities, interests and more.
This data can help you analyze trends, see what activities are working to deepen engagement, and see your donors’ full relationship with your whole organization.
When it comes to year-end fundraising, I like to think of analytics in three ways: for you, for your executive team, and for your constituents. I’ll explain.
1. For you
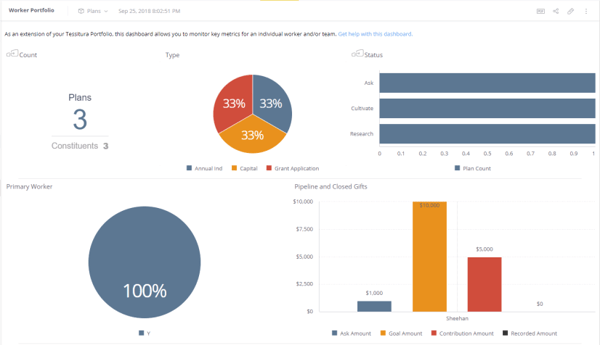
Tessitura includes pre-built dashboards designed to answer common questions for fundraisers and other arts and culture professionals. The Worker Portfolio dashboard monitors key metrics for individuals and/or your entire fundraising team. You can analyze your portfolio of prospects and donors to focus your efforts. Select the widgets you need to track plan type and status, pipeline and closed gifts, steps due soon, and more.

The Worker Portfolio displays a comprehensive portfolio summary for individuals or your entire fundraising team
2. For your executive team
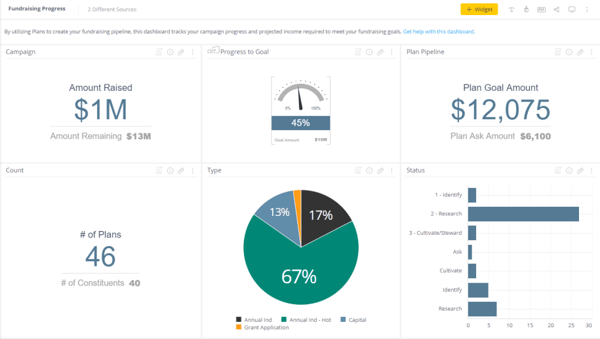
The end of the year often means board and committee meetings. You, your executive team and your board have the same overarching institutional goals. But the metrics you each use to evaluate your progress toward these goals may vary. The number of plans in an individual portfolio may not be of interest to your executive team, but plan goal amounts by quarter or plan fund progress can provide high-level insights into your progress. The Fundraising Progress dashboard tracks progress and projected income to meet your fundraising goals.
You can also personalize existing dashboards or create your own. For example, contextualize your progress by sharing things like year-over-year comparisons.
To share updates with your executive team, export specific widgets or entire dashboards to include in meeting documents. Or schedule them to be emailed to organizational leadership at their preferred time.

The Fundraising Progress dashboard provides current fundraising status and pipeline information.
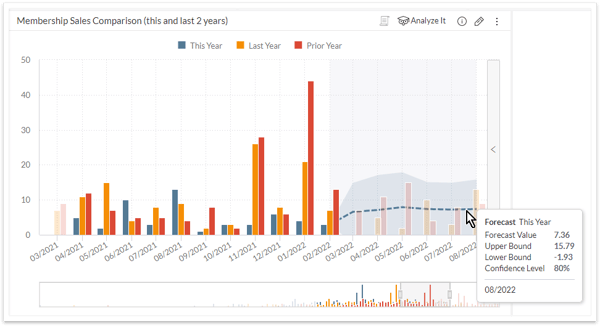
The ability to understand your donor’s behavior and keep on top of your organization’s progress is key to fundraising success, today and in the future. Not only can data help you plan future campaigns, but Analytics can also help you reduce uncertainty through predictive forecasting in some widgets.
The advanced artificial intelligence behind predictive forecasting uses a blend of modeling algorithms to produce the most accurate results. Not only are you able to compare this year and the last couple of years of transactional and attendance data, but Analytics will apply those algorithms to your data to model what the next year will look like.

Analytics uses artificial intelligence to provide predictive forecasts.
3. For your constituents
Sharing donor impact can be a helpful fundraising tool and is essential to successful stewardship and engagement. Insights from Tessitura Analytics can support fundraising asks. For example, use Pulse to set up an alert that’s triggered at a certain threshold, like reaching 85% of your total fundraising goal. When you get the alert that you’ve reached your threshold, you can send an email thanking donors for their support in reaching this milestone and asking them to help you finish the year strong with an additional gift.
You can also rely on data and insights from Analytics when it’s time to create your annual report or a donor impact report. Tessitura’s pre-built dashboards measure KPIs that are important to arts & cultural organizations, and they’re here to help make your job easier.
Let Tessitura Analytics support you and your executive team’s data-driven decision making and improve your donor journeys to deepen engagement.
Questions about Analytics? Let us help! Reach out anytime.
Top photo by Campaign Creators on Unsplash
Topics
Arts & Culture
/Fundraising
/BI & Analytics

Ashley Walker
Solutions Manager
Tessitura Network

I shouldn't be here
Innovator Series / Arts & Culture / DEAI
A journey of belonging and breaking barriers

Feels like home
Arts & Culture / Audience Development / Business Strategy
Andrew Recinos describes how warmth, familiarity and connection offer the magic ingredients to create lifelong fans

Hedgehogs and hospitality
Arts & Culture / Innovator Series / Community Engagement / Business Strategy
A case study in values-driven strategy at Irish Arts Center