Analytics
Tessitura
Company News
Technology
Article
Insights & Innovation
ea2c33c3-c729-4689-93fe-0a24b76486d3
6 min
https://edge.sitecorecloud.io/tessituraneab9a-tessiturane5642-staging-5396/media/Images/Discover-Images/Insights-and-Inspiration/Interactions-dashboards-768x465.jpg?h=465&iar=0&w=768
Explore your customer journeys like never before
Introducing Tessitura’s interactions dashboards

Associate Director, Business Intelligence, Tessitura
Introducing Tessitura’s interactions dashboards
8/4/2025
6 min
With Tessitura v16, we introduced a powerful new way for marketing, development, box office and customer service teams to explore customer journeys.
In our latest release, we’ve added new interactions dashboards to give you a deeper view of all the ways visitors engage with your organization.
Identify interactions that matter
Every touchpoint tells a story. With these new dashboards, you can easily see how customers move from one touchpoint to another.
Gone are the days of looking at transactions in isolation. The new dashboards help you visualize the entire spectrum of audience interactions. You’re able to connect emails opened, tickets scanned, memberships upgraded, contributions made, special activities attended and even customer service issues. You can follow customers across departments and over time — all in one place.
The dashboards let you spot trends and patterns. You can identify what drives engagement, what causes drop-offs and where opportunities exist. And you can act with confidence, using these insights to inform outreach, improve service and strengthen relationships.
Gain meaningful insights at a glance
To help you get started, we included six prebuilt dashboards with v16 (16.0.26+ required). Each answers real-world questions.
- Refine your marketing by understanding what messages lead to action.
- Strengthen donor cultivation by tracking engagement over time.
- Improve customer service by identifying and resolving issues faster.
- Make data-driven decisions across departments to drive maximum engagement.
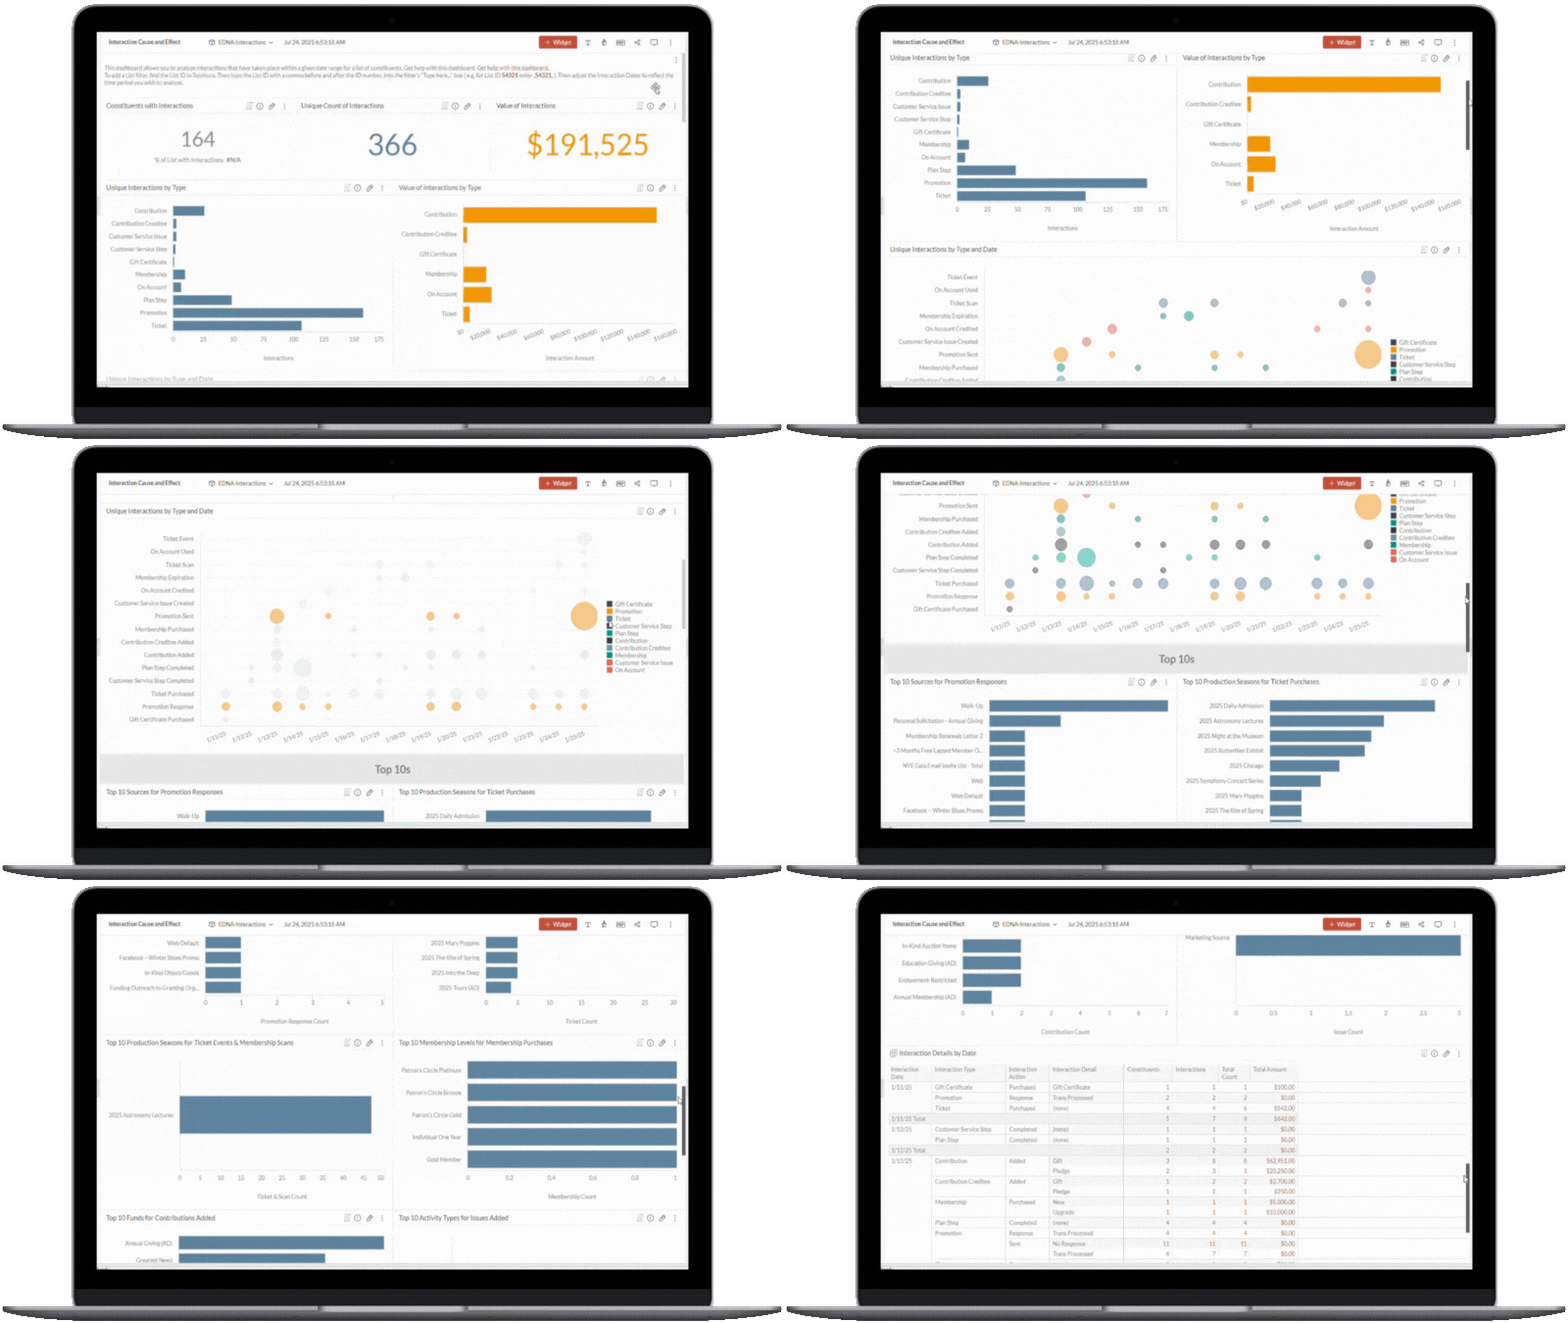
The Cause and Effect dashboard lets you pinpoint a moment in time — such as a campaign launch or a specific performance — to see what happened before and after. Did your email drive ticket sales? Did a specific exhibition inspire more donations? This dashboard helps you connect those dots to understand the ripple effects of your efforts.

Cause and Effect dashboard
The Constituent Profile dashboard offers a deep dive into a single patron’s history. It’s perfect for development teams looking to steward major donors or identify promising prospects. You can see when someone last gave, how often they attend and whether their engagement is growing or fading.
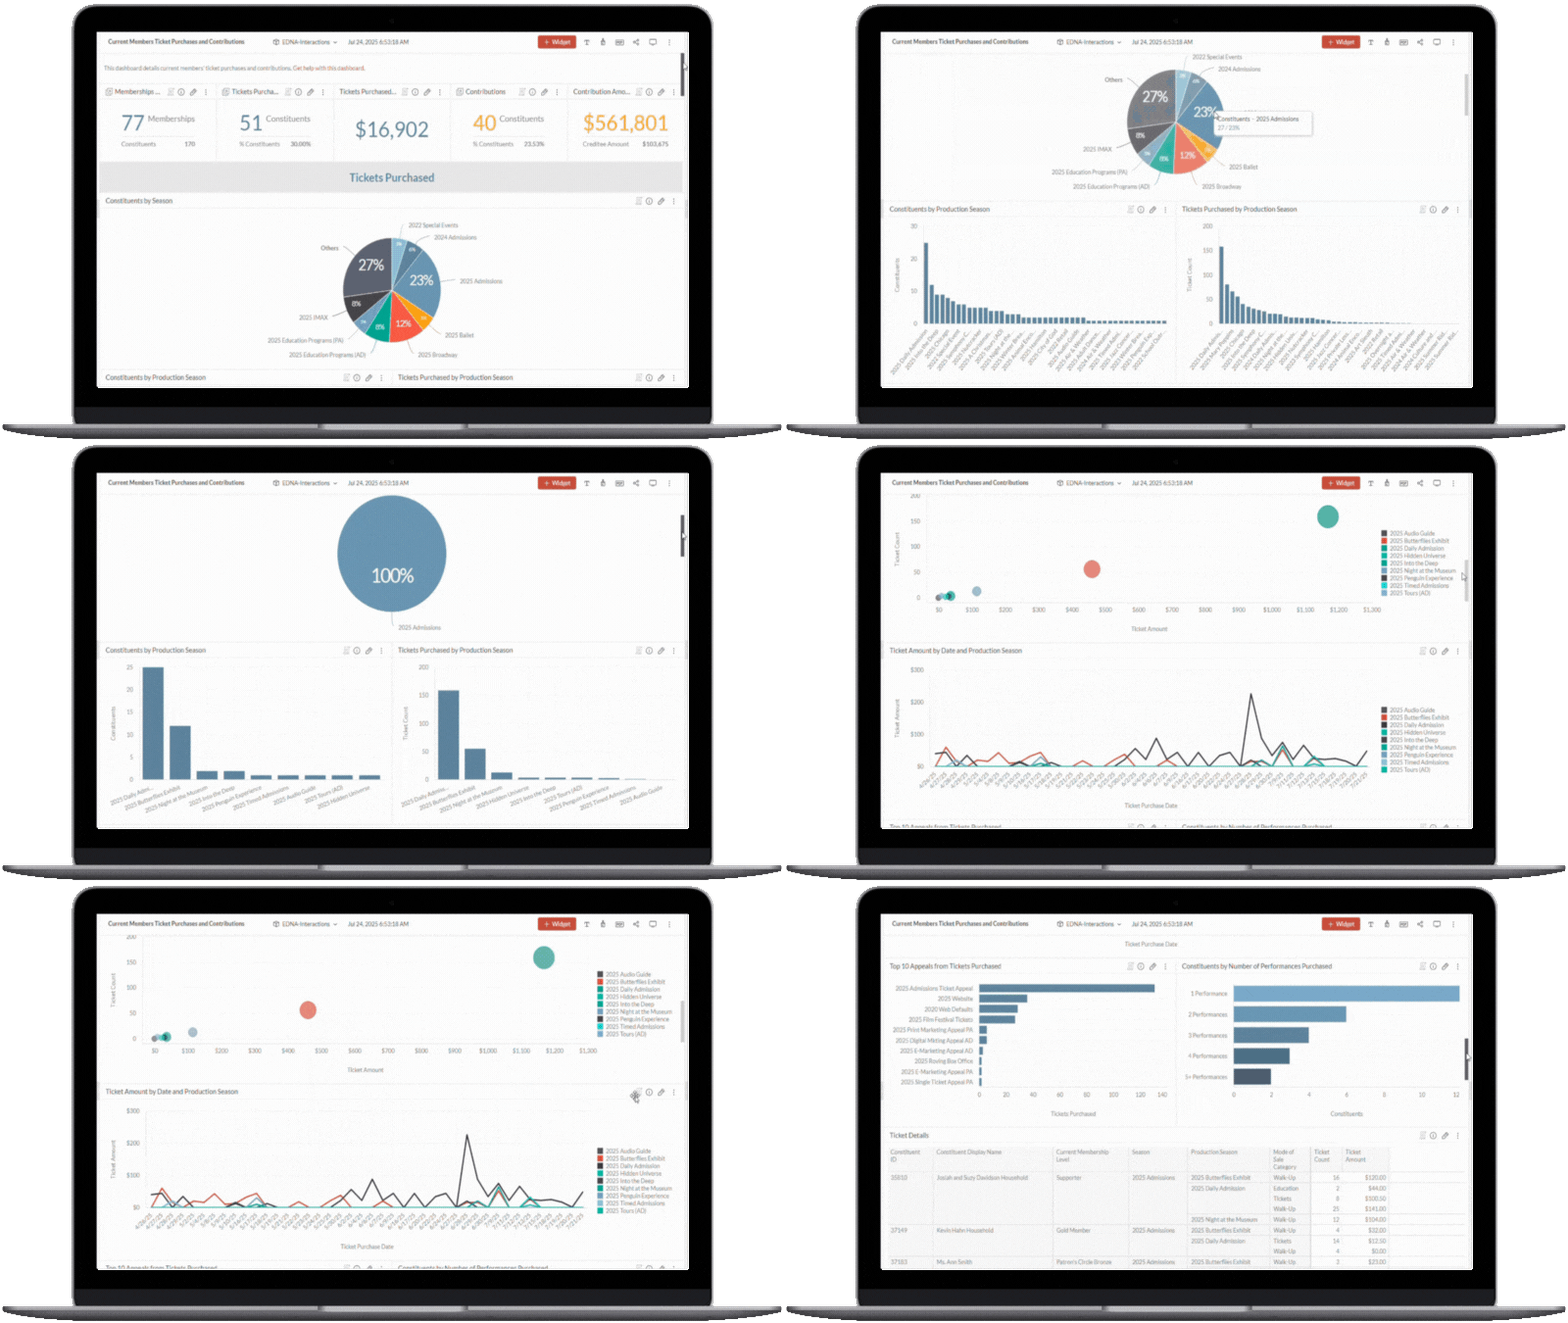
For a broader view, the Current Members: Ticket Purchases & Contributions dashboard reveals what your most loyal patrons do beyond their membership. Are they buying tickets? Making additional gifts? This insight helps you understand the added value your members bring to your organization so you can tailor your outreach accordingly.

Current Members: Ticket Purchases & Contributions dashboard
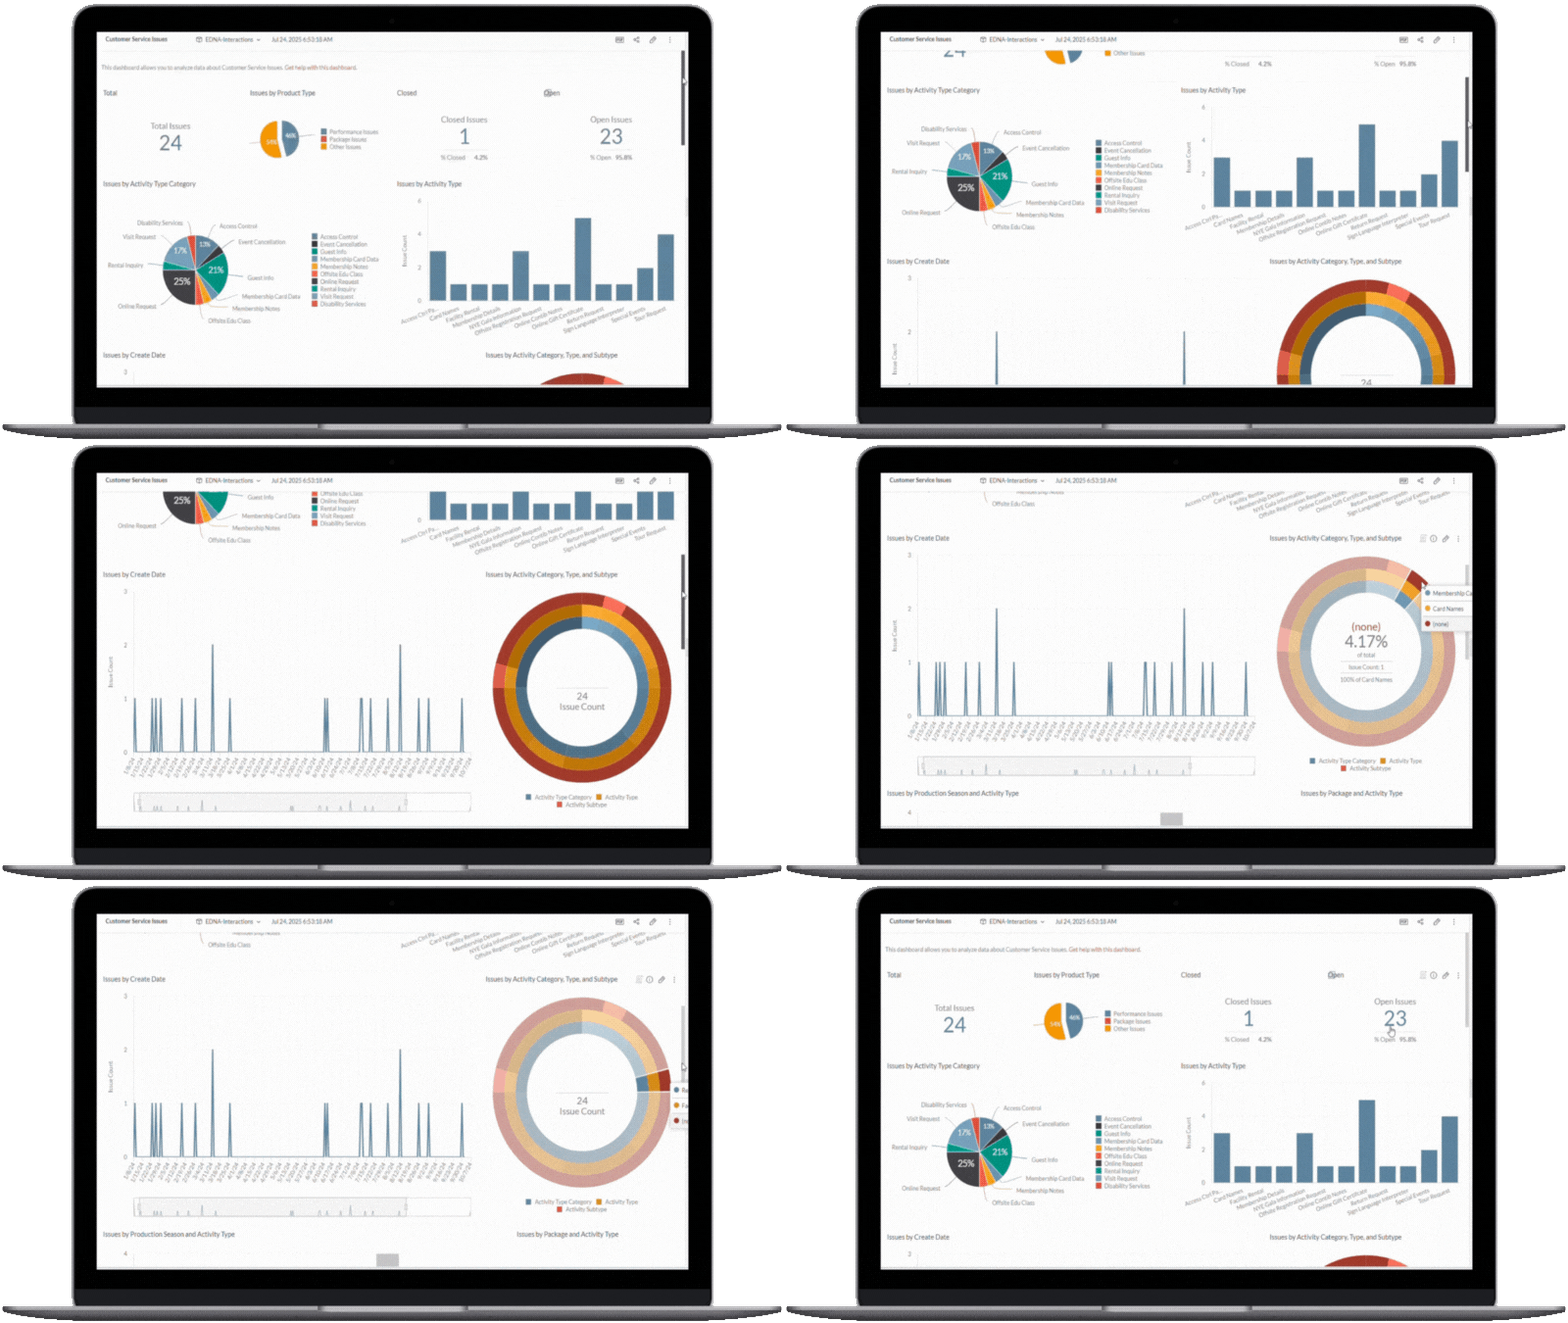
Customer service teams will appreciate the Customer Service Issues dashboard, which provides a clear overview of open and closed cases, trends over time and the types of issues that are most common. It’s a practical tool for improving response times and identifying areas for improvement.

Customer Service Issues dashboard
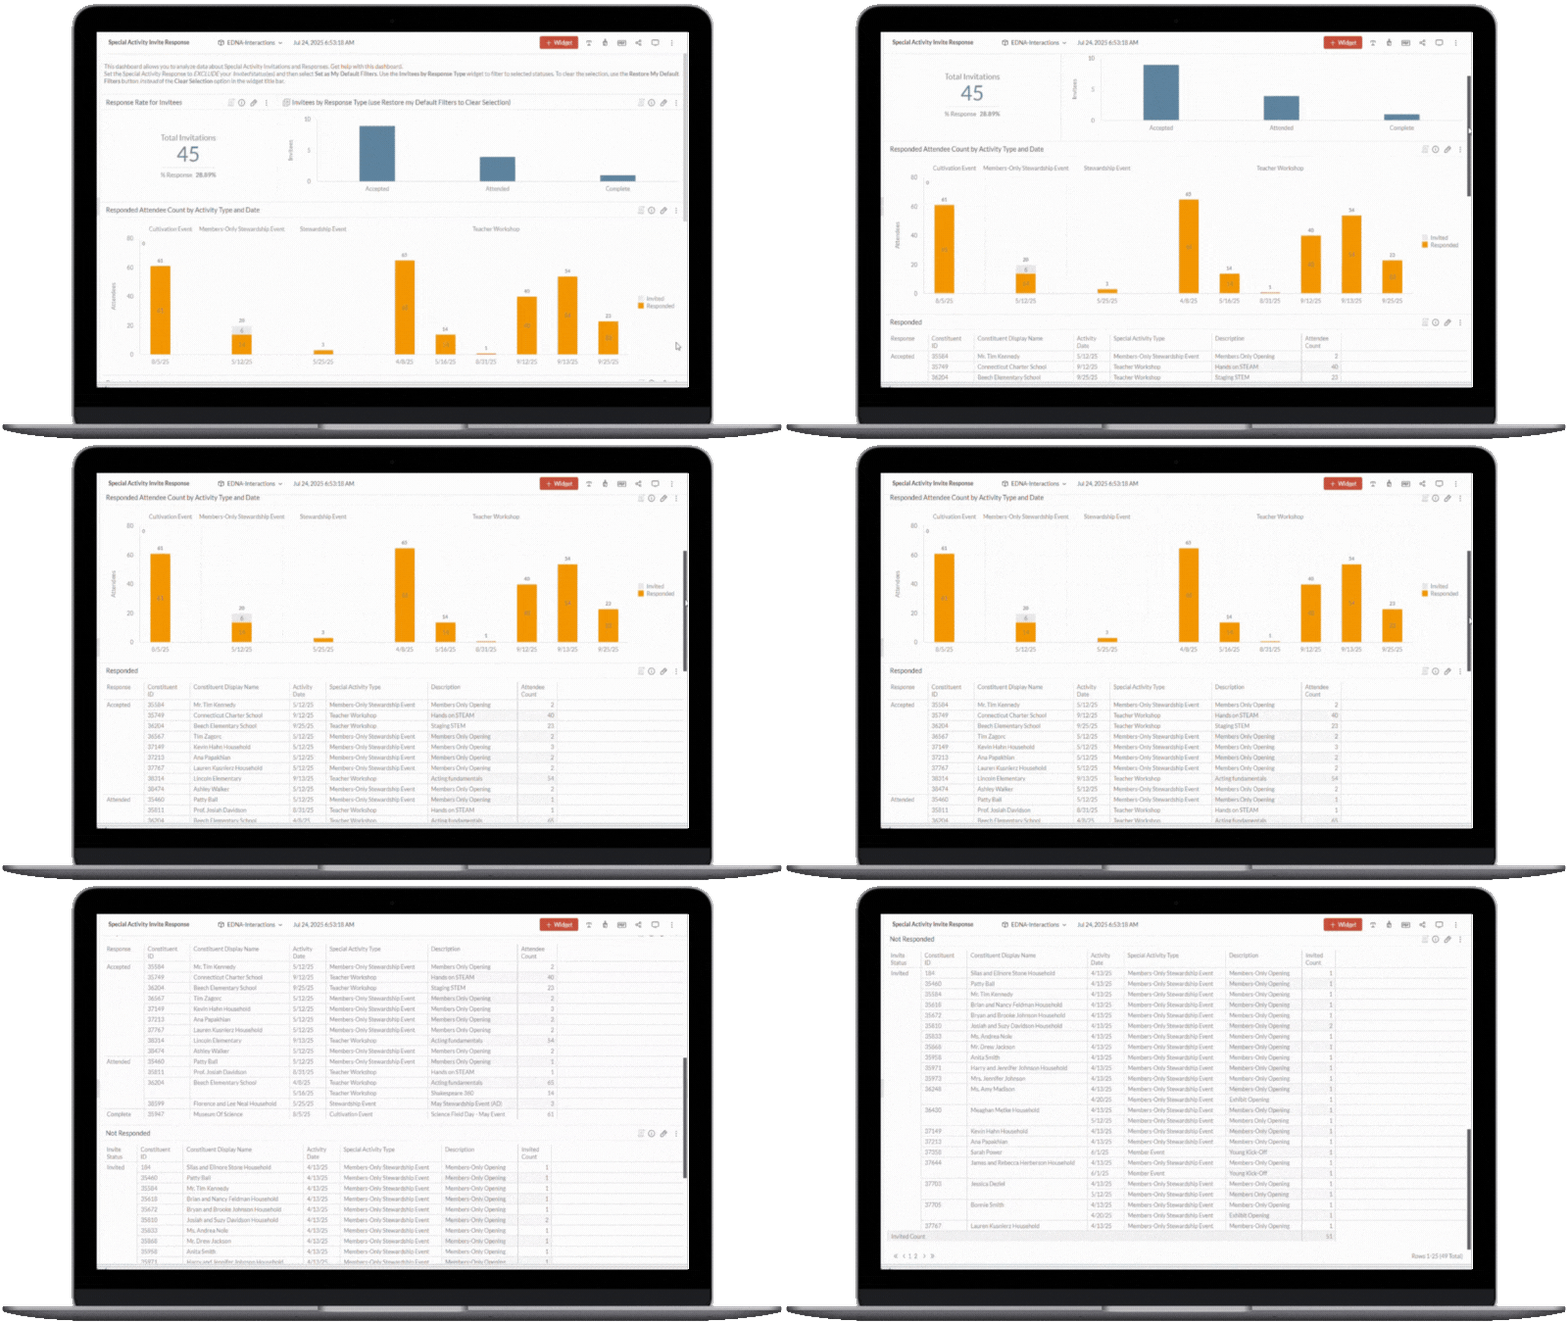
Meanwhile, the Special Activity Invite Response dashboard is great for fundraising and stewardship. It shows who was invited to your events, who responded and how those responses break down — helping you fine-tune your approach and follow up more effectively.

Special Activity Invite Response dashboard
Finally, the Appeal & Source Response dashboard gives marketing and development teams a clear view of campaign performance. You can track response and conversion rates, see which appeals drive action and measure the return on your investment.
Get more clarity, drive more impact
These dashboards give you a new way to think about your audiences. They help you move beyond transactions to see the full story of engagement. Whether you’re analyzing a single donor or an entire campaign, these tools give you the clarity and context you need to make smarter, more informed decisions.
But what makes these dashboards truly powerful is their ease of use. There’s no need to build anything from scratch. They’re ready to go as soon as you upgrade to v16. You can filter by date, campaign, interaction type and more, tailoring the insights to your specific needs.
And because they’re built on the same foundation as the rest of Tessitura Analytics, you can also create your own dashboards using the same interaction data.
Explore the full documentation to get started. Or open a support ticket for help with any questions.
Topics
Company News
/Technology

Exploring Tessitura's technology roadmap
Company News / Technology
A peek at how we decide our product priorities

Unique and special
Company News / Technology
Vice President of Product Debra Weissman shares takeaways from her first three months at Tessitura

Feels like home
Arts & Culture / Audience Development / Business Strategy
Andrew Recinos describes how warmth, familiarity and connection offer the magic ingredients to create lifelong fans